memcached_stats_rrd.py is a script for monitoring and graphing stats from Memcached or Membase.
Memcached is a high-performance, distributed memory object caching system, and Membase is the related key-value database management system. Both are open source, with packaged/commercial versions distributed by NorthScale. They both use the memcached protocol for communication, so this script will work against a vanilla memcached installation, or against a membase server/cluster.
For more info:
script source code: memcached_stats_rrd.py
This script is useful for ad-hoc monitoring or longer term trend/capacity analysis. It collects data, stores it in RRD databases, and outputs graphs and stats in the form of PNG images. You can monitor any stats that memcached/membase publishes and graph them over specified time spans. It will generate an image file for each stat, for each time span selected.
This mini monitoring system is built with:
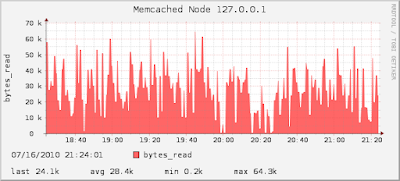
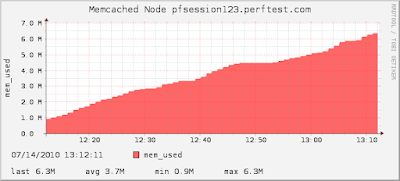
Sample Graph/Image Output:

(bytes_read, 3 hour timespan, 60 sec collection interval)

(mem_used, 1 hour timespan, 60 sec collection interval)
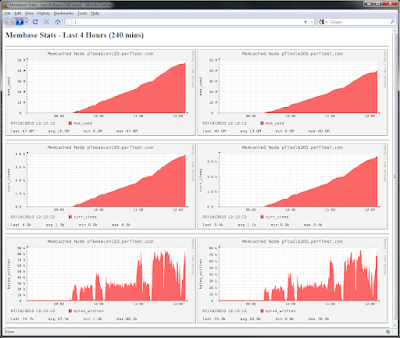
It will generate images in the directory you specify. I have an Apache web server installed serving content from the output directory for easy web viewing. You can wrap the images in some HTML and create a little dashboard to watch your entire memcached/membase cluster, like this:

(4 hour timespan, 60 sec collection interval, 2 nodes, 3 stats each)
Instructions...
1) Install prerequisites
You will need the following software installed:
- Python 2.x
- python-memcached (memcached client for Python)
- RRDTool (round-robin database, logging/graphing backend)
on Debian/Ubuntu:
$ sudo apt-get install -y python-memcache
$ sudo apt-get install -y rrdtool
2) Configure the script
Near the top of the script, there are a few configuration settings:
# Config Settings
NODES = ('192.168.1.3:11211', '192.168.1.4:11211')
INTERVAL = 60
STATS = (('curr_items', 'GAUGE'), ('bytes_written', 'COUNTER'))
GRAPH_MINS = (60, 180)
GRAPH_DIR = '/var/www/'
Config Setting Definitions:
- NODES: list of memcached/membase nodes to monitor.
- INTERVAL: collection interval in seconds. This should be the same value as you schedule the script to run.
- STATS: list of tuples containing (stat_name, datasource_type), where "stat_name" is a memcached/membase stat, and "datasource_type" is an RRDTool data source type (DST). The most useful data source types are GAUGE and COUNTER. GAUGE is used to report a current value, and COUNTER is used for continuous incrementing counters.
(see: http://oss.oetiker.ch/rrdtool/doc/rrdcreate.en.html for more info on RRD data sources)
- GRAPH_MINS: list of minutes, corresponding to time spans displayed in the output graphs. An image for each stat is generated for each value here.
- GRAPH_DIR: directory to generate out images in.
After you have the script configured, make the script executable:
$ chmod +x memcached_stats_rrd.py
3) Schedule the script
You can add an entry to your crontab (crontab -e) so cron will run it regularly. The example here uses a 60 sec (1 min) interval:
*/1 * * * * /home/perfserver/memcached_stats_rrd.py
[These instructions are for Linux/Unix, but you can configure a similar system on Windows using Task Scheduler instead of cron. The code in memcached_stats_rrd.py works cross-platform.]


