December 1, 2010

Python - Search a Local or Remote Splunk Server

Some basic instructions for searching Splunk from Python...

First, you must install Splunk on the machine you will run the Python script from. Splunk installs its own Python interpreter that you can use to run your code. I am using Splunk 4.14, which includes Python 2.6.

(It looks like you can set some environment variables and install a few Python dependencies along with the Python SDK and get this going "outside" of Splunk. But the easiest option is just to run on their interpreter).

To run your own Python scripts on Splunk's interpreter:
- save script into Splunk's "bin" directory
(usually "/opt/splunk/bin" or "C:\Program Files\Splunk\bin")
- go to the "bin" directory and run:
splunk cmd python your_script.py

So...
What goes in your Python code?

First, import the modules you will need:

 
import time
import splunk.auth
import splunk.search

Next, authenticate and get a session key.

For the local splunk host:

 
key = splunk.auth.getSessionKey('user', 'password')

If you are going to search a remote splunk host, you must authenticate against it by adding the "hostPath" parameter:

 
key = splunk.auth.getSessionKey('user', 'password', hostPath='https://mysplunk:8089')

Tips:
- use https, even if you are not using ssl in your splunk web interface
- 'admin' user doesn't seem to work. user a normal user/password.

Next, submit a search job.

For a local search:

 
job = splunk.search.dispatch('search index="os" *', earliest_time='-15m')

For a remote search, use the "hostPath" parameter again:

 
job = splunk.search.dispatch('search index="os" *', earliest_time='-15m', hostPath='https://mysplunk:8089')

print the job details:

 
print job

wait for the results:

 
while not job.isDone:
    time.sleep(.25)    

print results

 
for result in job.results:
    print result

Altogether in a Python script:

 
#!/usr/bin/env python
# Corey Goldberg - 2010
# 
#  search a remote splunk server
#
#  instructions:
#   - save script into splunk's "bin" directory
#     (usually "/opt/splunk/bin" or "C:\Program Files\Splunk\bin")
#   - go to the "bin" directory and run: 
#     $ splunk cmd python my_script.py
#


import time
import splunk.auth
import splunk.search


SPLUNK_SERVER = '192.168.12.173'
USER_NAME = 'foo'
PASSWORD = 'secret'
SEARCH_STRING = 'search index="os"'
EARLIEST_TIME = '-15m'


def main():
    # authenticate
    key = splunk.auth.getSessionKey(USER_NAME, PASSWORD, hostPath='https://%s:8089' % SPLUNK_SERVER)
    print 'auth key:\n%s' % key
    
    # submit a search job
    job = splunk.search.dispatch(SEARCH_STRING, earliest_time=EARLIEST_TIME, hostPath='https://%s:8089' % SPLUNK_SERVER)
    print 'job details:\n%s' % job

    # wait for results
    while not job.isDone:
        time.sleep(.25)
    
    print 'results:'    
    for result in job.results:
        print result


if __name__== '__main__':
    main()

October 8, 2010

Python - Shorten a URL Using Google's Shortening Service (goo.gl)

Using Python to shorten a URL with Google's shortening service (goo.gl):

 
#!/usr/bin/python 
#  Corey Goldberg - 2010

import json
import urllib
import urllib2


def shorten(url):
    gurl = 'http://goo.gl/api/url?url=%s' % urllib.quote(url)
    req = urllib2.Request(gurl, data='')
    req.add_header('User-Agent', 'toolbar')
    results = json.load(urllib2.urlopen(req))
    return results['short_url']


if __name__ == '__main__':
    print shorten('http://www.goldb.org/')
    print shorten('www.yahoo.com')

You give it a URL to shorten: shorten('http://www.goldb.org/long_url')

... and it returns a shortened URL for you: 'http://goo.gl/jh4W'

September 24, 2010

Python - Linux: Parse Network Stats From ifconfig

I needed to get some Linux networking stats in my Python program today. Specifically, I needed 'bytes sent' and 'bytes received' counts since last reboot from the local machine.

ifconfig is a network configuration utility for Linux that you run from the command line:

corey@studio17:~$ ifconfig eth0
eth0      Link encap:Ethernet  HWaddr 00:22:19:e5:07:31  
          inet addr:10.0.0.5  Bcast:10.0.0.255  Mask:255.255.255.0
          inet6 addr: fe80::222:19ff:fee5:731/64 Scope:Link
          UP BROADCAST RUNNING MULTICAST  MTU:1500  Metric:1
          RX packets:3353822 errors:0 dropped:0 overruns:0 frame:0
          TX packets:3052408 errors:0 dropped:0 overruns:0 carrier:0
          collisions:0 txqueuelen:1000 
          RX bytes:3476310326 (3.4 GB)  TX bytes:256706611 (256.7 MB)
          Interrupt:17 

The following function parses output from ifconfig to get the network stats I was after:

import re
import subprocess

def get_network_bytes(interface):
    output = subprocess.Popen(['ifconfig', interface], stdout=subprocess.PIPE).communicate()[0]
    rx_bytes = re.findall('RX bytes:([0-9]*) ', output)[0]
    tx_bytes = re.findall('TX bytes:([0-9]*) ', output)[0]
    return (rx_bytes, tx_bytes)

Example usage:

import re
import subprocess

def main():
    rx_bytes, tx_bytes = get_network_bytes('eth0')
    print '%s bytes received' % rx_bytes
    print '%s bytes sent' % tx_bytes
      
def get_network_bytes(interface):
    output = subprocess.Popen(['ifconfig', interface], stdout=subprocess.PIPE).communicate()[0]
    rx_bytes = re.findall('RX bytes:([0-9]*) ', output)[0]
    tx_bytes = re.findall('TX bytes:([0-9]*) ', output)[0]
    return (rx_bytes, tx_bytes)

if __name__ == '__main__':
    main()

Update: someone left an anonymous comment and mentioned you can just read from proc/net/dev rather than using ifconfig. I modified his code sample and came up with this:

def get_network_bytes(interface):
    for line in open('/proc/net/dev', 'r'):
        if interface in line:
            data = line.split('%s:' % interface)[1].split()
            rx_bytes, tx_bytes = (data[0], data[8])
            return (rx_bytes, tx_bytes)

Example Usage:

def main():
    rx_bytes, tx_bytes = get_network_bytes('eth0')
    print '%s bytes received' % rx_bytes
    print '%s bytes sent' % tx_bytes
      
def get_network_bytes(interface):
    for line in open('/proc/net/dev', 'r'):
        if interface in line:
            data = line.split('%s:' % interface)[1].split()
            rx_bytes, tx_bytes = (data[0], data[8])
            return (rx_bytes, tx_bytes)

if __name__ == '__main__':
    main()

September 23, 2010

My Chrome Users Now Outnumber Internet Explorer (Traffic Stats)

I really like to analyze the traffic to my various websites (homepage, blog, project pages, open source code).

Since my visitors must be somewhat interested in what I post, I like to think they are *just* *like* *me*.

So... of course, my own personal web metrics are better than anything else out there :)
(to you they might be worthless, but to me they are gold)

I get a pretty steady stream of about 40k pageviews per month. In the past year, I've served a paltry half million pageviews. But hey, its a good enough sample size to work with, and pretty flattering to have attracted that many eyeballs.

Look what happened this past month:


(stats from aug_22_2010 - sept_21_2010)

Chrome visitors overtook Internet Explorer in site usage.

Here is how it has been playing out in the past year and a half:

(Notice my Firefox visitors are waning a little also.)

September 22, 2010

Python - Multi-Mechanize Script With HTTP Profiling Timers

Multi-Mechanize is an open source framework for web performance and load testing. It allows you to run simultaneous python scripts to generate load (synthetic transactions) against a web site or web service.

The default response timer wraps the entire Transaction(), so it will time everything included. For more granular timing, you need to instrument your script code with custom timers.

Multi-Mechanize is pure Python and you have access to all of Python's standard library in your scripts. For example, you can use httplib to write a virtual user agent script and get detailed HTTP profiling times (TTFB, TTLB, etc). http://docs.python.org/library/httplib.html

 
import httplib
import time


class Transaction(object):
    def __init__(self):
        self.custom_timers = {}
    
    def run(self):
        conn = httplib.HTTPConnection('www.example.com')
        start = time.time()
        conn.request('GET', '/')
        request_time = time.time()
        resp = conn.getresponse()
        response_time = time.time()
        conn.close()     
        transfer_time = time.time()
        
        self.custom_timers['request sent'] = request_time - start
        self.custom_timers['response received'] = response_time - start
        self.custom_timers['content transferred'] = transfer_time - start
        
        assert (resp.status == 200), 'Bad HTTP Response'

To test it out, you can add this to the bottom of the script and run it from the command line:

 
if __name__ == '__main__':
    trans = Transaction()
    trans.run()
    
    for timer in ('request sent', 'response received', 'content transferred'):
        print '%s: %.5f secs' % (timer, trans.custom_timers[timer])

Output:

 
request sent: 0.14429 secs
response received: 0.25995 secs
content transferred: 0.26007 secs

* if you are running MS Windows, replace the time.time() calls with time.clock() for better timer accuracy. On all other operating systems, use time.time()

September 20, 2010

CSharp/.NET - Use Stopwatch() Instead of DateTime() for Accurate High Precision Timing

(originally posted at coreygoldberg.blogspot.com)

In C# (.NET), the DateTime() class is not accurate for high precision timing. Instead, use the Stopwatch() class if you need a timer. Most hardware and operating systems support a high-resolution performance counter that can be accessed through System.Diagnostics.Stopwatch.

Don't use DateTime() like this if you need accuracy:

 
using System;

class Program
{
    public static void Main()
    {
        DateTime start = DateTime.Now;

            // do timed work here

        DateTime stop = DateTime.Now;

        // don't do this. you won't get accurate timing
        Console.WriteLine("{0} ms", (stop - start).TotalMilliseconds);

        // definitely don't do this. you won't get accurate timing or full timer resolution
        Console.WriteLine("{0} ms", (stop - start).Milliseconds);
    }
}

Stopwatch() uses operating system's high-resolution performance counter:

 
using System;
using System.Diagnostics;

class Program
{
    public static void Main()
    {
        Stopwatch stopWatch = Stopwatch.StartNew();

            // do timed work here

        stopWatch.Stop();

        // don't do this. you won't get full timer resolution
        Console.WriteLine("{0} ms", stopWatch.ElapsedMilliseconds);

        // do this to get accurate high precision timing
        Console.WriteLine("{0} ms", stopWatch.Elapsed.TotalMilliseconds);
    }
}

The Stopwatch class is in the System.Diagnostics namespace:

 
using System.Diagnostics;

Stopwatch measures elapsed time by counting timer ticks in the underlying timer mechanism. If the installed hardware and operating system support a high-resolution performance counter, then the Stopwatch class uses that counter to measure elapsed time. Otherwise, the Stopwatch class uses the system timer (DateTime class) to measure elapsed time.

To see if your system supports a high-resolution performance counter, check the Stopwatch.IsHighResolution property:

 
if (Stopwatch.IsHighResolution)
    Console.WriteLine("Using the system's high-resolution performance counter.");
else 
    Console.WriteLine("Using the DateTime class.");

To check the timing accuracy, use the Stopwatch.Frequency property:

 
long frequency = Stopwatch.Frequency;

Console.WriteLine("Timer frequency in ticks per second: {0}", frequency);

long nanosecPerTick = (1000L*1000L*1000L) / frequency;

Console.WriteLine("Timer is accurate within {0} nanoseconds", nanosecPerTick);

August 1, 2010

Load Testing Web Services with Python and Multi-Mechanize

(originally posted at coreygoldberg.blogspot.com)

I had to test and benchmark a SOAP web service recently, and figured I'd write up some instructions for load testing with Multi-Mechanize.

Multi-Mechanize is a performance and load testing framework that enables you to write plugins (in Python) to create virtual user scripts that run in parallel against your service.

Since Multi-Mechanize scripts are pure Python, you can use any Python module inside them. In the case of a web service that uses SOAP, you have a few options. You can use any 3rd party module, so something like Suds (a lightweight SOAP client lib) would be a reasonable choice. However, I decided to stick with the Python standard library and build my scripts with urllib2. Afterall, SOAP is just slinging a bunch of XML back-and-forth over HTTP.

So before I get started with Multi-Mechanize and performance/load testing...

Here is a Python (2.x) script using urllib2 to interact with a SOAP web service over HTTP:

import urllib2

with open('soap.xml') as f:
    soap_body = f.read()
    
req = urllib2.Request(url='http://www.foo.com/service', data=soap_body)
req.add_header('Content-Type', 'text/xml')
resp = urllib2.urlopen(req)
content = resp.read()

(The script above assumes you have a file named 'soap.xml' in the local directory that contains your payload (SOAP XML message). It will send an HTTP POST request containing your payload in the body.)

After the initial script is created in Python, the next step is to convert it into a Multi-Mechanize script. To do this, you create a Transaction class with a run() method and add your code there.

As a Multi-Mechanize script, the same thing would be done like this:

import urllib2


class Transaction(object):
    def __init__(self):
        with open('soap.xml') as f:
            self.soap_body = f.read()
    
    def run(self):
        req = urllib2.Request(url='http://www.foo.com/service', data=self.soap_body)
        req.add_header('Content-Type', 'text/xml')
        resp = urllib2.urlopen(req)
        content = resp.read()
        
        assert ('Example SOAP Response' in content), 'Failed Content Verification'

(Notice I also added an assert statement to verify the content returned from the service.)

Now that you have a script created, it's time to configure Multi-Mechanize and run some tests.

You can download Multi-Mechanize from: code.google.com
It requires Python 2.x (2.6 or 2.7), and if you want it to generate graphs, you must also install Matplotlib and its dependencies. See the FAQ for help.

Once you have Multi-Mechanize downloaded, unzip it and go to the "/projects" directory. You can create a new project directory here. You can call it "soap_project". Inside this directory, you will need 2 things: a config file ("config.cfg"), and a "test_scripts" directory (containing the script you previously created, which you can call "soap_client.py". Since the script is looking for a data file named "soap.xml", make sure you have one created in the main multi-mechanize directory.

The directory and file layout will look like this:

/multi-mechanize
    /lib
    /projects
        /soap_project
            /test_scripts
                soap_client.py
            config.cfg
    multi-mechanize.py
    soap.xml

(you can see the "default_project" for an example of how it should be setup.)

To begin with, you can use a simple config.cfg file like this:

[global]
run_time: 30
rampup: 0
console_logging: on
results_ts_interval: 10

[user_group-1]
threads: 1
script: soap_client.py

This will just a run a single thread of your virtual user script for 30 seconds; good enough for testing and getting things going.

To run a test, go to the topmost multi-mechanize directory and run:

$ python multi-mechanize.py soap_project

(You should see timer output in the console.)

Once you have things running well, you can turn off "console_logging" and increase the workload. It will take some adjustment and plenty of trials to get the load dialed in correctly for your service. You can also get a lot more sophisticated with your workload model and create multiple virtual user scripts doing different transactions. In this case, I'll keep it simple and just test one web service request type in isolation.

Once I ran plenty of iterations and got a feel for how the service responded and what its limits were, I settled with a config file like this:

[global]
run_time: 900
rampup: 900
console_logging: off
results_ts_interval: 90

[user_group-1]
threads: 30
script: soap_client.py

(30 threads, increasing load over 15 mins)

After each test run you do, a new results directory is created containing your test results. Look for "results.html" and view it in your browser to see the output report.


Have questions about Multi-Mechanize?
Post to the discussion group: groups.google.com/group/multi-mechanize

July 27, 2010

Rackspace Cloud - Outbound Bandwidth Caps, Network Too Slow

Have you seen the network/bandwidth caps that Rackspace places on their cloud servers?

From the Rackspace Cloud Server FAQ:

"Your Cloud Server has a bandwidth cap that is applied in relation to the size of the server. Please note that the bandwidth caps are placed on outbound bandwidth only. Inbound bandwidth is not capped."

Server SizePublic LimitServiceNet Limit
256MB10 Mbps20 Mbps
512MB20 Mbps40 Mbps
1024MB30 Mbps60 Mbps
2048MB40 Mbps80 Mbps
4096MB50 Mbps100 Mbps
8192MB60 Mbps120 Mbps
15872MB70 Mbps140 Mbps

I was going to use the Rackspace Cloud to do some performance testing of a new server. I wanted to run 2 servers in a clustered mode, replicating data to each other. My first concern was the speed of the internal network interconnects between cloud nodes.

After doing some research, I realized the bandwidth caps make it a non-starter. 20-140 Mbps private interconnects?? That's not enough. I would saturate the network almost immediately, even on their largest server class. Sorry Rackspace.

In comparison, Amazon's EC2 Cloud offers High Performance Computing nodes with 10 Gigabit interconnects: Amazon HPC

July 25, 2010

WebInject - New Discussion Group Launched

I just started a new discussion group for WebInject:

http://groups.google.com/group/webinject

The old forums (http://www.webinject.org/cgi-bin/forums/YaBB.cgi) have been broken for several years. I will leave them up in read-only mode, but some threads are broken and unviewable.

Feel free to post a message to this new discussion group.
questions, bugs, patches, collaboration, comments, welcome...

Updates and new development coming soon...


WebInject is a free tool for automated testing and monitoring of web applications or services. It can be used standalone, or as a plugin for external monitoring systems.

July 23, 2010

Membase Stats Report (Python)

[Membase is a high-performance, distributed key-value database (NoSQL)]

To check operational stats of your Membase server/cluster, you can use the telnet interface (port 11211) and issue the stats command to any individual node:

$ telnet 192.168.12.11 11211
stats

The output is unsorted and a little difficult to read at quick glance.


I use the following Python script for getting a quick snapshot of stats from Membase in a more readable format. Since Membase speaks the Memcached protocol, I use the python-memcached module. List all nodes you want stats from.

#!/usr/bin/env python
# Corey Goldberg - 2010 (goldb.org)
# print a stats report from membase key-value database (membase.org)
# python 2.x
# requires python-memcached


import memcache


NODES = ('192.168.12.11:11211',) 

mc = memcache.Client(NODES)

for node_stats in mc.get_stats():
    server, stats = node_stats
    print '-----------------------------------------'
    print server
    print '-----------------------------------------'
    for stat_name, value in sorted(stats.iteritems()):
        if not stat_name.startswith('ep'):
            if stat_name not in ('libevent', 'version'):
                print stat_name.ljust(25), value.rjust(15)
    print '-----------------------------------------'
    for stat_name, value in sorted(stats.iteritems()):
        if stat_name.startswith('ep'):
            if stat_name not in ('ep_dbname', 'ep_version'):
                print stat_name.ljust(25), value.rjust(15)

sample output (1 node):

$ python membase_stats_report.py
 -----------------------------------------
 127.0.0.1:11211 (1)
 -----------------------------------------
 auth_cmds                               0
 auth_errors                             0
 bytes_read                       81754885
 bytes_written                    77239947
 cas_badval                              0
 cas_hits                                0
 cas_misses                              0
 cmd_flush                               1
 cmd_get                            370229
 cmd_set                            380230
 conn_yields                             0
 connection_structures                  16
 curr_connections                       16
 curr_items                         178679
 daemon_connections                     10
 decr_hits                               0
 decr_misses                             0
 delete_hits                             0
 delete_misses                           0
 get_hits                           370228
 get_misses                              1
 incr_hits                               0
 incr_misses                             0
 limit_maxbytes                   67108864
 mem_used                         40909042
 pid                                  2009
 pointer_size                           64
 rejected_conns                          0
 rusage_system                   65.660000
 rusage_user                    113.320000
 threads                                 4
 time                           1278257466
 total_connections                      16
 uptime                                592
 -----------------------------------------
 ep_commit_time                          1
 ep_data_age                           286
 ep_data_age_highwat                   286
 ep_dbinit                               0
 ep_flush_duration                       1
 ep_flush_duration_highwat               2
 ep_flusher_state                  running
 ep_flusher_todo                       483
 ep_item_commit_failed                   0
 ep_item_flush_failed                    0
 ep_max_txn_size                     50000
 ep_min_data_age                         1
 ep_queue_age_cap                        5
 ep_queue_size                      176786
 ep_storage_age                        286
 ep_storage_age_highwat                286
 ep_tap_keepalive                        0
 ep_tap_total_fetched                    0
 ep_tap_total_queue                      0
 ep_too_old                           1410
 ep_too_young                        56372
 ep_total_enqueued                  380487
 ep_total_persisted                 198703
 ep_warmed_up                       479990
 ep_warmup                            true
 ep_warmup_thread                 complete
 ep_warmup_time                          4

script source code: membase_stats_report.py

For more advaned stats and graphing from Memcached and Membase, see:
http://coreygoldberg.blogspot.com/2010/07/monitoring-stats-from-memcached-or.html

July 19, 2010

Monitoring Stats From Memcached or Membase (Python, RRDTool)

memcached_stats_rrd.py is a script for monitoring and graphing stats from Memcached or Membase.

Memcached is a high-performance, distributed memory object caching system, and Membase is the related key-value database management system. Both are open source, with packaged/commercial versions distributed by NorthScale. They both use the memcached protocol for communication, so this script will work against a vanilla memcached installation, or against a membase server/cluster.

For more info:


script source code: memcached_stats_rrd.py

This script is useful for ad-hoc monitoring or longer term trend/capacity analysis. It collects data, stores it in RRD databases, and outputs graphs and stats in the form of PNG images. You can monitor any stats that memcached/membase publishes and graph them over specified time spans. It will generate an image file for each stat, for each time span selected.

This mini monitoring system is built with:

Sample Graph/Image Output:


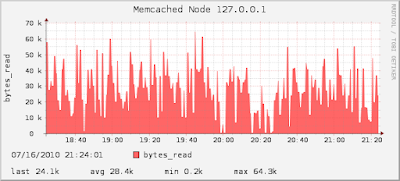
(bytes_read, 3 hour timespan, 60 sec collection interval)

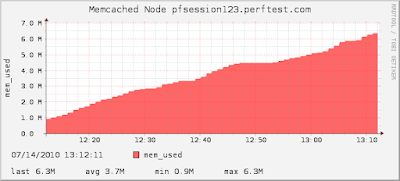
(mem_used, 1 hour timespan, 60 sec collection interval)

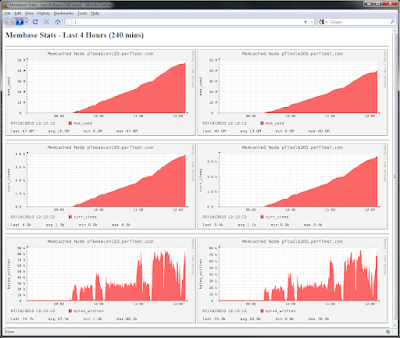
It will generate images in the directory you specify. I have an Apache web server installed serving content from the output directory for easy web viewing. You can wrap the images in some HTML and create a little dashboard to watch your entire memcached/membase cluster, like this:


(4 hour timespan, 60 sec collection interval, 2 nodes, 3 stats each)

Instructions...

1) Install prerequisites

You will need the following software installed:

  • Python 2.x
  • python-memcached (memcached client for Python)
  • RRDTool (round-robin database, logging/graphing backend)

on Debian/Ubuntu:

$ sudo apt-get install -y python-memcache
$ sudo apt-get install -y rrdtool

2) Configure the script

Near the top of the script, there are a few configuration settings:

# Config Settings
NODES = ('192.168.1.3:11211', '192.168.1.4:11211')
INTERVAL = 60
STATS = (('curr_items', 'GAUGE'), ('bytes_written', 'COUNTER'))
GRAPH_MINS = (60, 180)
GRAPH_DIR = '/var/www/'

Config Setting Definitions:

  • NODES: list of memcached/membase nodes to monitor.
  • INTERVAL: collection interval in seconds. This should be the same value as you schedule the script to run.
  • STATS: list of tuples containing (stat_name, datasource_type), where "stat_name" is a memcached/membase stat, and "datasource_type" is an RRDTool data source type (DST). The most useful data source types are GAUGE and COUNTER. GAUGE is used to report a current value, and COUNTER is used for continuous incrementing counters. (see: http://oss.oetiker.ch/rrdtool/doc/rrdcreate.en.html for more info on RRD data sources)
  • GRAPH_MINS: list of minutes, corresponding to time spans displayed in the output graphs. An image for each stat is generated for each value here.
  • GRAPH_DIR: directory to generate out images in.

After you have the script configured, make the script executable:

$ chmod +x memcached_stats_rrd.py

3) Schedule the script

You can add an entry to your crontab (crontab -e) so cron will run it regularly. The example here uses a 60 sec (1 min) interval:

*/1 * * * * /home/perfserver/memcached_stats_rrd.py

[These instructions are for Linux/Unix, but you can configure a similar system on Windows using Task Scheduler instead of cron. The code in memcached_stats_rrd.py works cross-platform.]

July 1, 2010

6 Command Line Tools for Linux Performance Monitoring

So you need to monitor a Linux system for performance metrics... CPU, Memory, Network, Disk, etc.

Here are 6 of my favorite command line tools for monitoring a Linux system from the command line.


htop

http://htop.sourceforge.net/
dstat

http://dag.wieers.com/home-made/dstat/
bmon

http://freshmeat.net/projects/bmon/
iftop

http://www.ex-parrot.com/pdw/iftop/
ifstat

http://gael.roualland.free.fr/ifstat/
sysstat
this is a package of utilites including iostat, mpstat, sar, and others.

http://pagesperso-orange.fr/sebastien.godard/

These tools are all available from package managers (apt-get, yum, etc) on most Linux systems. They are also available on most other *nix platforms.

March 16, 2010

Running Multi-Mechanize on RackSpace Cloud Servers with Ubuntu

This post is about Multi-Mechanize, the web performance and load testing framework.
visit the project website: multimechanize.com

Here are some instructions for getting started on rackspace cloud. These are also general instructions for anyone using a debian/ubuntu system.

There are _lots_ of options for running multi-mechanize in the cloud. You have choices between several cloud vendors and hosting/vps providers. Then you have a choice of operating system to deploy onto. I've found the combination of rackpsace cloud servers and ubuntu to be a really good choice. I see it as a great platform to run cloud-based load tests from (though hopefully they will offer other geographic regions at some point). It has been a breeze to work with multi-mechanize on this infrastructure.

So far i've been very impressed with rackspace. It lacks some of the functionality and management feature that EC2 gives you, but it is much easier to use. you pay by the hour + bandwidth used (starting at 1.5cents/hour). It's dead simple to deploy servers, and they have lots of linux operating systems to choose from. You can login to your account and provision the latest Ubuntu Server (9.10) in literally seconds. Need multiple servers? no prob. need _lots_ of servers? no prob, use the API's they provide. very slick stuff.

So... to get multi-mechanize working on rackspace's service...

create a rackspace account:
http://www.rackspacecloud.com/cloud_hosting_products/servers

login to your account:
https://manage.rackspacecloud.com

Deploy a new server from your account (choose the latest Ubuntu image). You can start with the minimum RAM allocation, and later resize your server to run large tests. Once you create your server, Rackspace will email you the server's ip address and root password.

Open a terminal window and ssh into your server using the info they supplied:

>ssh <ip address> -l root 

(enter password when prompted)

First, setup the dependencies for multi-mechanize.
run the following commands:

>apt-get install -y python-mechanize 
>apt-get install -y python-matplotlib 
>apt-get install -y subversion 

Now you can grab the latest multi-mechanize trunk from subversion:

>cd /opt 
>svn checkout http://multi-mechanize.googlecode.com/svn/trunk/ multi-mechanize 

Now go to your multi-mechanize directory and run a test:

>cd /opt/multi-mechanize 
>python multi-mechanize.py default_project 

thats it...

February 14, 2010

Multi-Mechanize - new open source performance testing tool

To all perfmormance and load testers out there...

I am working on a new tool/framework for web load testing. yes, that's right, another one.

My last tool, Pylot, was very limited because of the fact that you had to create a test script in a declarative format. I have come to the conclusion that you *need* a scripting language for defining test cases, and decided to develop a scriptable performance testing tool.

visit the project site: Multi-Mechanize


Multi-Mechanize is an open source framework for web performance and load testing. It allows you to run simultaneous python scripts to generate load (synthetic transactions) against a web site or web service.

In your scripts, you have the convenience of mechanize along with the power of the full Python programming language at your disposal. You programmatically create test scripts to simulate virtual user activity. Your scripts will then generate HTTP requests to intelligently navigate a web site or send requests to a web service.

Multi-Mechanize uses a multi-process, multi-threaded engine to replay your scripts and generate concurrent virtual users.

Results are saved in CSV format along with an HTML report containing stats and graphs.

comments, questions, collaboration welcome...

there is a discussion group for the new tool here: group.multimechanize.com
feel free to post!

January 14, 2010

Python - Web Load Tester - Multiple Processes and Threads

Here is my latest HTTP load generator in Python (web performance test). You just give it a URL and some runtime parameters and it will hammer a resource with HTTP requests. You could easily adapt this to run against a web service or set of links. It is useful for quickly loading a web resource with synthetic transactions for performance testing or tuning purposes.

I have built lots of different load testing tool in Python in the past (see: Pylot), but they all suffered a similar problem. Their concurrency model was based on Threads. Because of this threaded design, combined with Python's GIL implemenatation, my tools were unable to fully utilize multiple cores or processors.

Load generators shouldn't really suffer from processor contention because they are inherently IO-bound, not CPU-bound. However, if you add some client-side processing (response parsing, content verification, etc) and SSL, you could quickly run into a situation where you need more CPU horsepower.

The addition of multiprocessing in Python 2.6 gives me a whole new set of ideas for distributing load over multiple OS processes. It allows me to sidestep the GIL limitation of using a purely threaded model for concurrency. So now I can spawn multiple processes (to scale across processors/cores), with each one spawning multiple threads (for non-blocking i/o). This combination of processes and threads makes the basis for a very scalable and powerful load generating tool.


The Script:
http_load_multiprocess_multithread.py

In the code, you can define the following constants:

URL = 'http://www.example.com/foo?q=bar'
PROCESSES = 4
PROCESS_THREADS = 10
INTERVAL = 2  # secs
RUN_TIME = 60  # secs
RAMPUP = 60  # secs

It is a single Python script with no dependencies. I tested it on a dual quad-core system and it scaled nicely across all 8 cores. I hope to use something like this as a synthetic transaction engine at the core of a new load testing tool.

The output of the script is a single file named 'results.csv' with raw timing data in the following CSV format:

elapsed time, response time, http status

It looks like this:

0.562,0.396,200
0.562,0.319,200
0.578,0.405,200
0.578,0.329,200
...

Here is what the raw data looks like as a scatter plot:

To get more useful information, you need to do some post-processing on the results data. Here is a small script that will crunch some of the data from the results file. It breaks the data up into a time-series and calculates throughput and average response time per interval.

http_load_multiprocess_multithread_results_parse.py

Once you have this derived data, you can graph it it to get a more useful view of how the test and system performed.

January 13, 2010

Python - Command Line Progress Bar With Percentage and Elapsed Time Display

Here is a Python module which produces an ascii command line progress bar with percentage and elapsed time display.

code:
progress_bar.py

to use:

from progress_bar import ProgressBar

p = ProgressBar(60)
    
p.update_time(15)
print p
    
p.fill_char = '='
p.update_time(40)
print p

results:

[##########       25%                  ]  15s/60s
[=================67%=====             ]  40s/60s

January 10, 2010

Python - Lookup Google PageRank Score

Here is a Python module for getting the PageRank of a site from Google. It uses the Google Toolbar 3.0.x/4.0.x Pagerank Checksum Algorithm.

The code is here:

pagerank.py

You can import it as a module and use its get_pagerank(url) method to lookup the PageRank of a URL from your Python code.

For example:

#!/usr/bin/env python

import pagerank

rank = pagerank.get_pagerank('http://www.google.com')
print rank

* note: only use this within Google's terms of service