July 27, 2010

Rackspace Cloud - Outbound Bandwidth Caps, Network Too Slow

Have you seen the network/bandwidth caps that Rackspace places on their cloud servers?

From the Rackspace Cloud Server FAQ:

"Your Cloud Server has a bandwidth cap that is applied in relation to the size of the server. Please note that the bandwidth caps are placed on outbound bandwidth only. Inbound bandwidth is not capped."

Server SizePublic LimitServiceNet Limit
256MB10 Mbps20 Mbps
512MB20 Mbps40 Mbps
1024MB30 Mbps60 Mbps
2048MB40 Mbps80 Mbps
4096MB50 Mbps100 Mbps
8192MB60 Mbps120 Mbps
15872MB70 Mbps140 Mbps

I was going to use the Rackspace Cloud to do some performance testing of a new server. I wanted to run 2 servers in a clustered mode, replicating data to each other. My first concern was the speed of the internal network interconnects between cloud nodes.

After doing some research, I realized the bandwidth caps make it a non-starter. 20-140 Mbps private interconnects?? That's not enough. I would saturate the network almost immediately, even on their largest server class. Sorry Rackspace.

In comparison, Amazon's EC2 Cloud offers High Performance Computing nodes with 10 Gigabit interconnects: Amazon HPC

July 25, 2010

WebInject - New Discussion Group Launched

I just started a new discussion group for WebInject:

http://groups.google.com/group/webinject

The old forums (http://www.webinject.org/cgi-bin/forums/YaBB.cgi) have been broken for several years. I will leave them up in read-only mode, but some threads are broken and unviewable.

Feel free to post a message to this new discussion group.
questions, bugs, patches, collaboration, comments, welcome...

Updates and new development coming soon...


WebInject is a free tool for automated testing and monitoring of web applications or services. It can be used standalone, or as a plugin for external monitoring systems.

July 23, 2010

Membase Stats Report (Python)

[Membase is a high-performance, distributed key-value database (NoSQL)]

To check operational stats of your Membase server/cluster, you can use the telnet interface (port 11211) and issue the stats command to any individual node:

$ telnet 192.168.12.11 11211
stats

The output is unsorted and a little difficult to read at quick glance.


I use the following Python script for getting a quick snapshot of stats from Membase in a more readable format. Since Membase speaks the Memcached protocol, I use the python-memcached module. List all nodes you want stats from.

#!/usr/bin/env python
# Corey Goldberg - 2010 (goldb.org)
# print a stats report from membase key-value database (membase.org)
# python 2.x
# requires python-memcached


import memcache


NODES = ('192.168.12.11:11211',) 

mc = memcache.Client(NODES)

for node_stats in mc.get_stats():
    server, stats = node_stats
    print '-----------------------------------------'
    print server
    print '-----------------------------------------'
    for stat_name, value in sorted(stats.iteritems()):
        if not stat_name.startswith('ep'):
            if stat_name not in ('libevent', 'version'):
                print stat_name.ljust(25), value.rjust(15)
    print '-----------------------------------------'
    for stat_name, value in sorted(stats.iteritems()):
        if stat_name.startswith('ep'):
            if stat_name not in ('ep_dbname', 'ep_version'):
                print stat_name.ljust(25), value.rjust(15)

sample output (1 node):

$ python membase_stats_report.py
 -----------------------------------------
 127.0.0.1:11211 (1)
 -----------------------------------------
 auth_cmds                               0
 auth_errors                             0
 bytes_read                       81754885
 bytes_written                    77239947
 cas_badval                              0
 cas_hits                                0
 cas_misses                              0
 cmd_flush                               1
 cmd_get                            370229
 cmd_set                            380230
 conn_yields                             0
 connection_structures                  16
 curr_connections                       16
 curr_items                         178679
 daemon_connections                     10
 decr_hits                               0
 decr_misses                             0
 delete_hits                             0
 delete_misses                           0
 get_hits                           370228
 get_misses                              1
 incr_hits                               0
 incr_misses                             0
 limit_maxbytes                   67108864
 mem_used                         40909042
 pid                                  2009
 pointer_size                           64
 rejected_conns                          0
 rusage_system                   65.660000
 rusage_user                    113.320000
 threads                                 4
 time                           1278257466
 total_connections                      16
 uptime                                592
 -----------------------------------------
 ep_commit_time                          1
 ep_data_age                           286
 ep_data_age_highwat                   286
 ep_dbinit                               0
 ep_flush_duration                       1
 ep_flush_duration_highwat               2
 ep_flusher_state                  running
 ep_flusher_todo                       483
 ep_item_commit_failed                   0
 ep_item_flush_failed                    0
 ep_max_txn_size                     50000
 ep_min_data_age                         1
 ep_queue_age_cap                        5
 ep_queue_size                      176786
 ep_storage_age                        286
 ep_storage_age_highwat                286
 ep_tap_keepalive                        0
 ep_tap_total_fetched                    0
 ep_tap_total_queue                      0
 ep_too_old                           1410
 ep_too_young                        56372
 ep_total_enqueued                  380487
 ep_total_persisted                 198703
 ep_warmed_up                       479990
 ep_warmup                            true
 ep_warmup_thread                 complete
 ep_warmup_time                          4

script source code: membase_stats_report.py

For more advaned stats and graphing from Memcached and Membase, see:
http://coreygoldberg.blogspot.com/2010/07/monitoring-stats-from-memcached-or.html

July 19, 2010

Monitoring Stats From Memcached or Membase (Python, RRDTool)

memcached_stats_rrd.py is a script for monitoring and graphing stats from Memcached or Membase.

Memcached is a high-performance, distributed memory object caching system, and Membase is the related key-value database management system. Both are open source, with packaged/commercial versions distributed by NorthScale. They both use the memcached protocol for communication, so this script will work against a vanilla memcached installation, or against a membase server/cluster.

For more info:


script source code: memcached_stats_rrd.py

This script is useful for ad-hoc monitoring or longer term trend/capacity analysis. It collects data, stores it in RRD databases, and outputs graphs and stats in the form of PNG images. You can monitor any stats that memcached/membase publishes and graph them over specified time spans. It will generate an image file for each stat, for each time span selected.

This mini monitoring system is built with:

Sample Graph/Image Output:


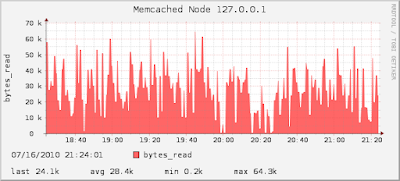
(bytes_read, 3 hour timespan, 60 sec collection interval)

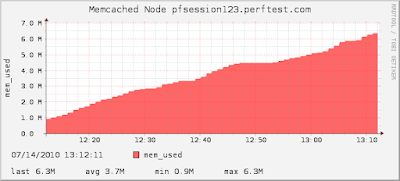
(mem_used, 1 hour timespan, 60 sec collection interval)

It will generate images in the directory you specify. I have an Apache web server installed serving content from the output directory for easy web viewing. You can wrap the images in some HTML and create a little dashboard to watch your entire memcached/membase cluster, like this:


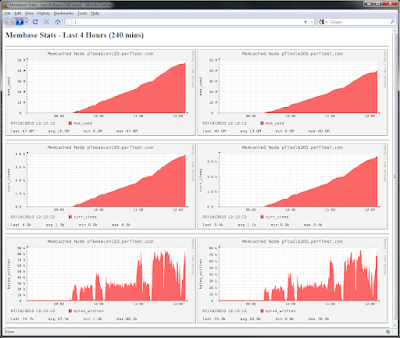
(4 hour timespan, 60 sec collection interval, 2 nodes, 3 stats each)

Instructions...

1) Install prerequisites

You will need the following software installed:

  • Python 2.x
  • python-memcached (memcached client for Python)
  • RRDTool (round-robin database, logging/graphing backend)

on Debian/Ubuntu:

$ sudo apt-get install -y python-memcache
$ sudo apt-get install -y rrdtool

2) Configure the script

Near the top of the script, there are a few configuration settings:

# Config Settings
NODES = ('192.168.1.3:11211', '192.168.1.4:11211')
INTERVAL = 60
STATS = (('curr_items', 'GAUGE'), ('bytes_written', 'COUNTER'))
GRAPH_MINS = (60, 180)
GRAPH_DIR = '/var/www/'

Config Setting Definitions:

  • NODES: list of memcached/membase nodes to monitor.
  • INTERVAL: collection interval in seconds. This should be the same value as you schedule the script to run.
  • STATS: list of tuples containing (stat_name, datasource_type), where "stat_name" is a memcached/membase stat, and "datasource_type" is an RRDTool data source type (DST). The most useful data source types are GAUGE and COUNTER. GAUGE is used to report a current value, and COUNTER is used for continuous incrementing counters. (see: http://oss.oetiker.ch/rrdtool/doc/rrdcreate.en.html for more info on RRD data sources)
  • GRAPH_MINS: list of minutes, corresponding to time spans displayed in the output graphs. An image for each stat is generated for each value here.
  • GRAPH_DIR: directory to generate out images in.

After you have the script configured, make the script executable:

$ chmod +x memcached_stats_rrd.py

3) Schedule the script

You can add an entry to your crontab (crontab -e) so cron will run it regularly. The example here uses a 60 sec (1 min) interval:

*/1 * * * * /home/perfserver/memcached_stats_rrd.py

[These instructions are for Linux/Unix, but you can configure a similar system on Windows using Task Scheduler instead of cron. The code in memcached_stats_rrd.py works cross-platform.]

July 1, 2010

6 Command Line Tools for Linux Performance Monitoring

So you need to monitor a Linux system for performance metrics... CPU, Memory, Network, Disk, etc.

Here are 6 of my favorite command line tools for monitoring a Linux system from the command line.


htop

http://htop.sourceforge.net/
dstat

http://dag.wieers.com/home-made/dstat/
bmon

http://freshmeat.net/projects/bmon/
iftop

http://www.ex-parrot.com/pdw/iftop/
ifstat

http://gael.roualland.free.fr/ifstat/
sysstat
this is a package of utilites including iostat, mpstat, sar, and others.

http://pagesperso-orange.fr/sebastien.godard/

These tools are all available from package managers (apt-get, yum, etc) on most Linux systems. They are also available on most other *nix platforms.